What is a good conversion rate for a small business website?
What the 2024 and 2026 conversion rate benchmarks really say, why they disagree, and how to read your own small business number.
TL;DR
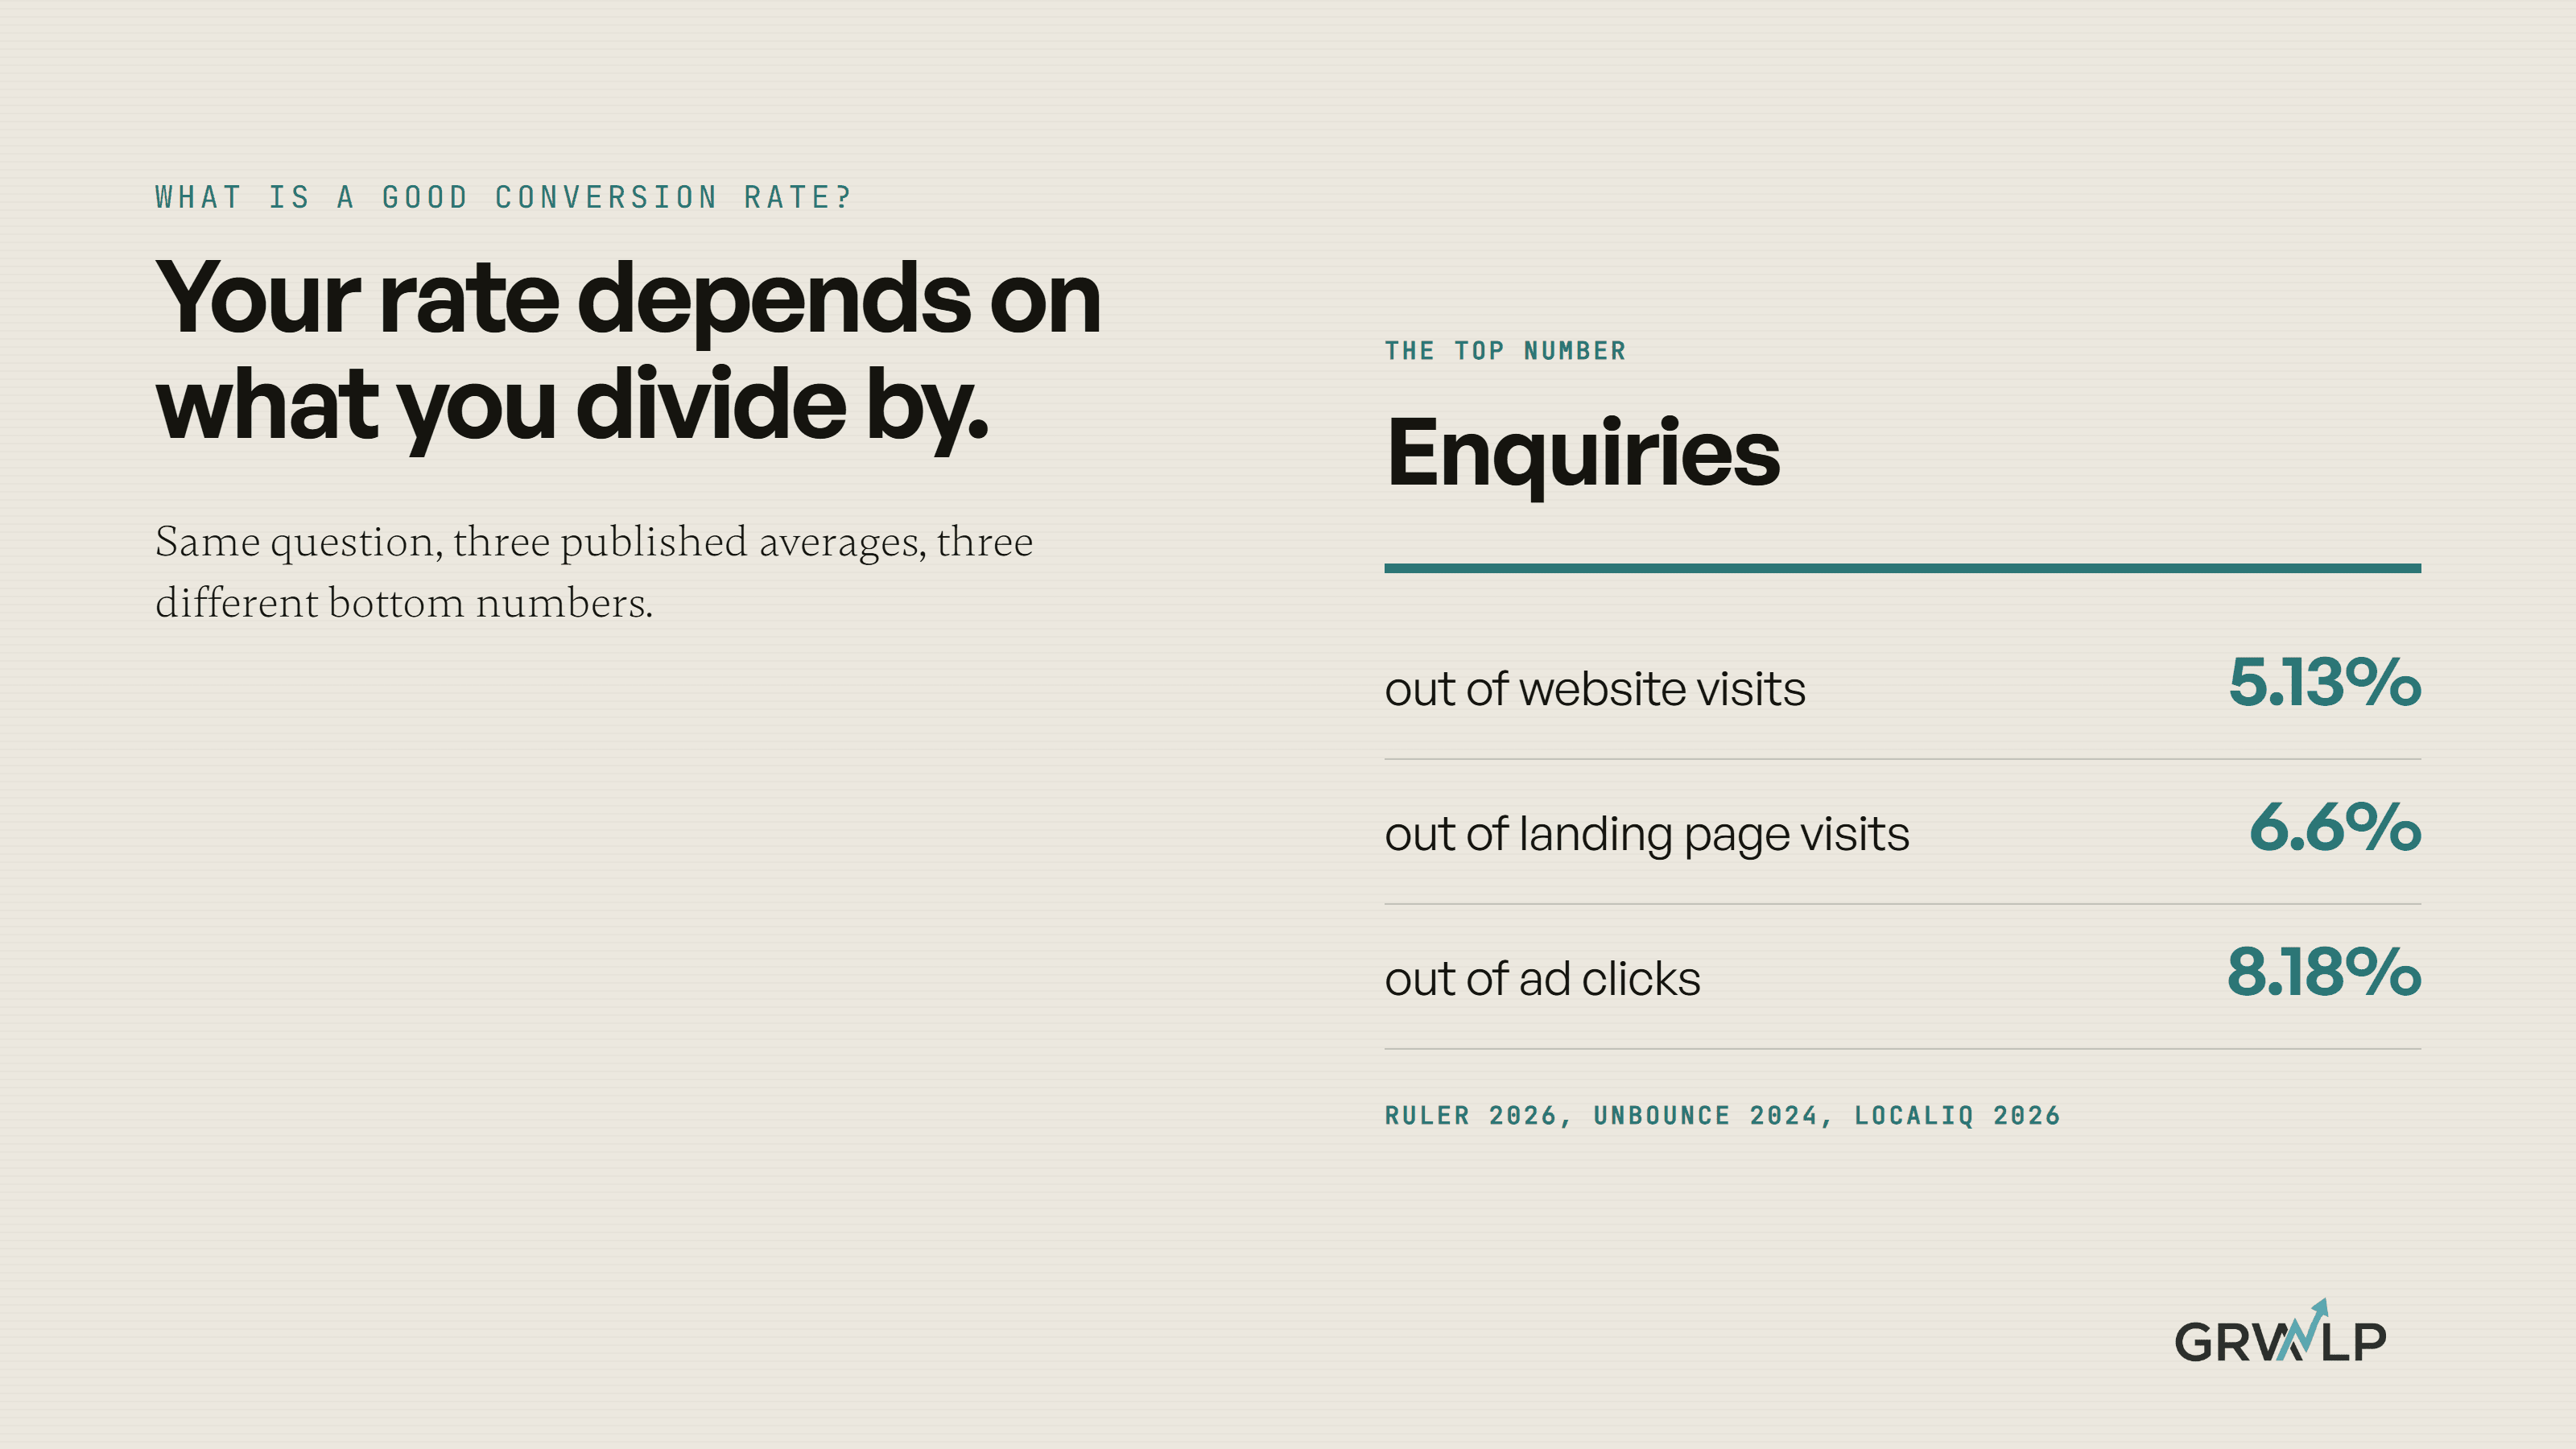
About 5 in 100 is a fair target, if you count the way the benchmarks count. Ruler Analytics puts the 2026 average at 5.13% of website visits becoming a qualified lead, Unbounce's median landing page converts 6.6%, and LocaliQ's Google Ads average is 8.18% of clicks. Count calls and WhatsApp taps before you compare.
Last updated 14 October 2026. Written by Oyekola Obajuwon, founder of Growveloper, a growth studio that builds the website, the marketing and the follow up for owner run businesses in the United States, the United Kingdom and Nigeria.
About 5 in 100 is a fair target, if you count the way the benchmarks count. Ruler Analytics puts the 2026 average at 5.13% of website visits becoming a qualified lead, Unbounce's median landing page converts 6.6%, and LocaliQ's Google Ads average is 8.18% of clicks. Count calls and WhatsApp taps before you compare.
Most owners who ask this have already found a number in a guide, worked out their own, and started to worry. Often the website is not the problem. The two numbers were counted in different ways, so holding one against the other says nothing. We call that the borrowed benchmark: a rate built from someone else's top and bottom numbers, held up against yours.
What conversion rate do the published benchmarks give?
Three benchmarks published in the last two and a half years say where their numbers come from. They do not agree, and the reason sits in the middle column.
Three conversion rate benchmarks and what each one divides
| Benchmark | What it counts, out of what | Typical rate |
|---|---|---|
| Ruler Analytics, May 2026 | Qualified leads or sales, out of website visits | 5.13% average |
| Unbounce, 2024 | Clicks or form fills, out of visits to one landing page | 6.6% median |
| LocaliQ, June 2026 | Leads, out of clicks on a Google ad | 8.18% average |
Ruler Analytics' 2026 benchmark is built on more than 5 million conversions across 13 industries, and it defines a conversion as "a qualified lead or sale", which is the closest of the three to what an owner means by an enquiry. Unbounce's 2024 Conversion Benchmark Report covers more than 41,000 landing pages and 57 million conversions, and says "the median conversion rate across all industries is 6.6%." LocaliQ's search advertising benchmarks, last updated on 1 June 2026, divide "the number of leads you get" by ad clicks.
The figure most guides repeat, 2.35%, is missing from the table on purpose. We could not follow it back to a sample we could read.
Why do the conversion rate benchmarks disagree?
Because a rate is two numbers, and each study picked a different bottom one.
A visit to your whole website includes people checking your address, your opening hours or a job advert. A visit to a landing page, the single page an ad sends people to, comes from someone who clicked an offer a few seconds ago. A click on a Google ad comes from someone who typed what they needed and chose you out of the list. Each crowd is warmer than the last, so each rate comes out higher. None of them is wrong. They are measuring different crowds.
The same industry shows it. Ruler puts legal firms at 7.9%. LocaliQ puts attorneys and legal services at 5.55%. That is not two studies arguing about lawyers. One counts qualified leads out of all visits, the other counts leads out of ad clicks, from different customers in different countries.
So before you compare, write down what your own rate divides. Enquiries out of all website visits: Ruler is your nearest match. One page your ads point at: Unbounce. Leads out of Google Ads clicks: LocaliQ.
What is a good conversion rate for my kind of business?
The studies split by industry, and the spread inside each study is wider than the gap between them.
In Ruler's 2026 figures, construction and engineering firms average 4.9%, professional services 6.1%, legal 7.9%, real estate 2.8%, and health and social care 2.3%. In LocaliQ's 2026 Google Ads figures, home and home improvement businesses average 8.05%, dentists 10.67%, physicians and surgeons 12.43%, and business services 4.85%. Unbounce says its nine industry medians run from 3.8% to 12.3%.
Read each one as the middle of a crowd of businesses that were paying for marketing software, mostly in the US and the UK. None of the three publishes a figure for Nigeria, and we found no study of Nigerian websites that states its sample. A Lagos business can use the same figures as a rough guide, with the change in the next section.
Why is my conversion rate lower than the benchmark?
Usually because your website is doing more than your number shows. The most common gap is the phone.
Ruler tracks calls as well as forms, and in its 2026 split, 52.6% of conversions for professional services firms came by phone. For legal firms it was 56.3%, for health and social care 37.2%, and for construction and engineering 22.2%. A website that counts only form submissions misses every one of those. For a professional services firm whose real rate is 3%, a forms only count would show about 1.4%, and the owner would start redesigning a page that was working.
In Nigeria the missing enquiry is often a tap on a WhatsApp button rather than a call. The fix is the same either way: count every way a visitor can reach you before you judge the rate. The first step in our guide to improving your website's conversion rate is exactly that, forms, calls and WhatsApp taps each recorded.
How much can one month's conversion rate tell me?
Less than it looks, on a small site. A month with few visits gives a rate that could easily have come out a point higher or lower by chance.
How wide one month's rate really is, for a site showing 3%
| Visits that month | Enquiries | The real rate is probably between |
|---|---|---|
| 500 | 15 | 1.8% and 4.9% |
| 1,000 | 30 | 2.1% and 4.3% |
| 3,000 | 90 | 2.4% and 3.7% |
| 10,000 | 300 | 2.7% and 3.4% |
At 1,000 visits a month, a site showing 3% might really be a 2% site having a good month or a 4% site having a bad one. That is the whole distance between "below average" and "fine" in the benchmarks above. Put three months together, or this quarter against the same quarter last year, and the range narrows. It is also why our guide to a monthly marketing report leads with enquiries and money, not with a rate on its own.
What did we find when we first measured a real business?
At Baye Business Solutions, a cloud services company in Lagos with about 25 staff, I worked inside the business as its developer and marketer for six months. When I started, there was no conversion rate to improve. The case study puts it in six words: "No analytics. No Google tracking. No intake forms."
The company offered eight categories of service and had no page for any of them. So the first job was not making the number better. It was making a number exist: Google Analytics and Microsoft Clarity on the site, and a page for every service, so each kind of enquiry had somewhere to land. For the first time, in the case study's words, the company "had visibility into who visited their site and where they dropped off." No benchmark means anything until that is true.
So what conversion rate should I aim for?
Our judgement, from the figures above.
If you count calls, forms and WhatsApp out of all visits
Around 5% over a quarter puts you near Ruler's 2026 average. Under 2% over a quarter, with enough visits to trust it, is worth an evening watching recordings of real visits.
If you count forms only
Expect much less than the benchmark if your customers like to phone, and fix the counting before you touch the page.
If you are measuring one landing page for an ad
Unbounce's 6.6% median is the comparison, and LocaliQ's figure for your industry if the ad runs on Google.
The comparison that beats all three
Your own rate, counted the same way, this quarter against last. It is the only benchmark with your customers in it.
If you would rather someone checked the counting with you, our Growth Audit looks at tracking before anything else, and our marketing service includes monthly reporting in plain language. For trades and clinics, the local services page shows what we build for businesses whose customers call first. Or book a free 30 minute call and bring your numbers.
A rate is a fraction. Before you worry about the top number, check you are dividing by the right bottom one.
“None of them is wrong. They are measuring different crowds.”
Written by Oyekola Obajuwon