How do I improve my website's conversion rate?
Why a small business website cannot prove an A/B test, and the count, watch, change method that improves the conversion rate instead.
TL;DR
On a small business website, improve your conversion rate by watching visitors, not testing them. First make sure every enquiry is counted, including calls and WhatsApp taps. Then watch recordings of real visits with a free tool such as Microsoft Clarity, fix the first place people get stuck, and compare a month before with a month after.
Last updated 1 October 2026. Written by Oyekola Obajuwon, founder of Growveloper, who builds the website, the marketing and the follow up for owner run businesses in the United States, the United Kingdom and Nigeria.
On a small business website, improve your conversion rate by watching visitors, not testing them. First make sure every enquiry is counted, including calls and WhatsApp taps. Then watch recordings of real visits with a free tool such as Microsoft Clarity, fix the first place people get stuck, and compare a month before with a month after.
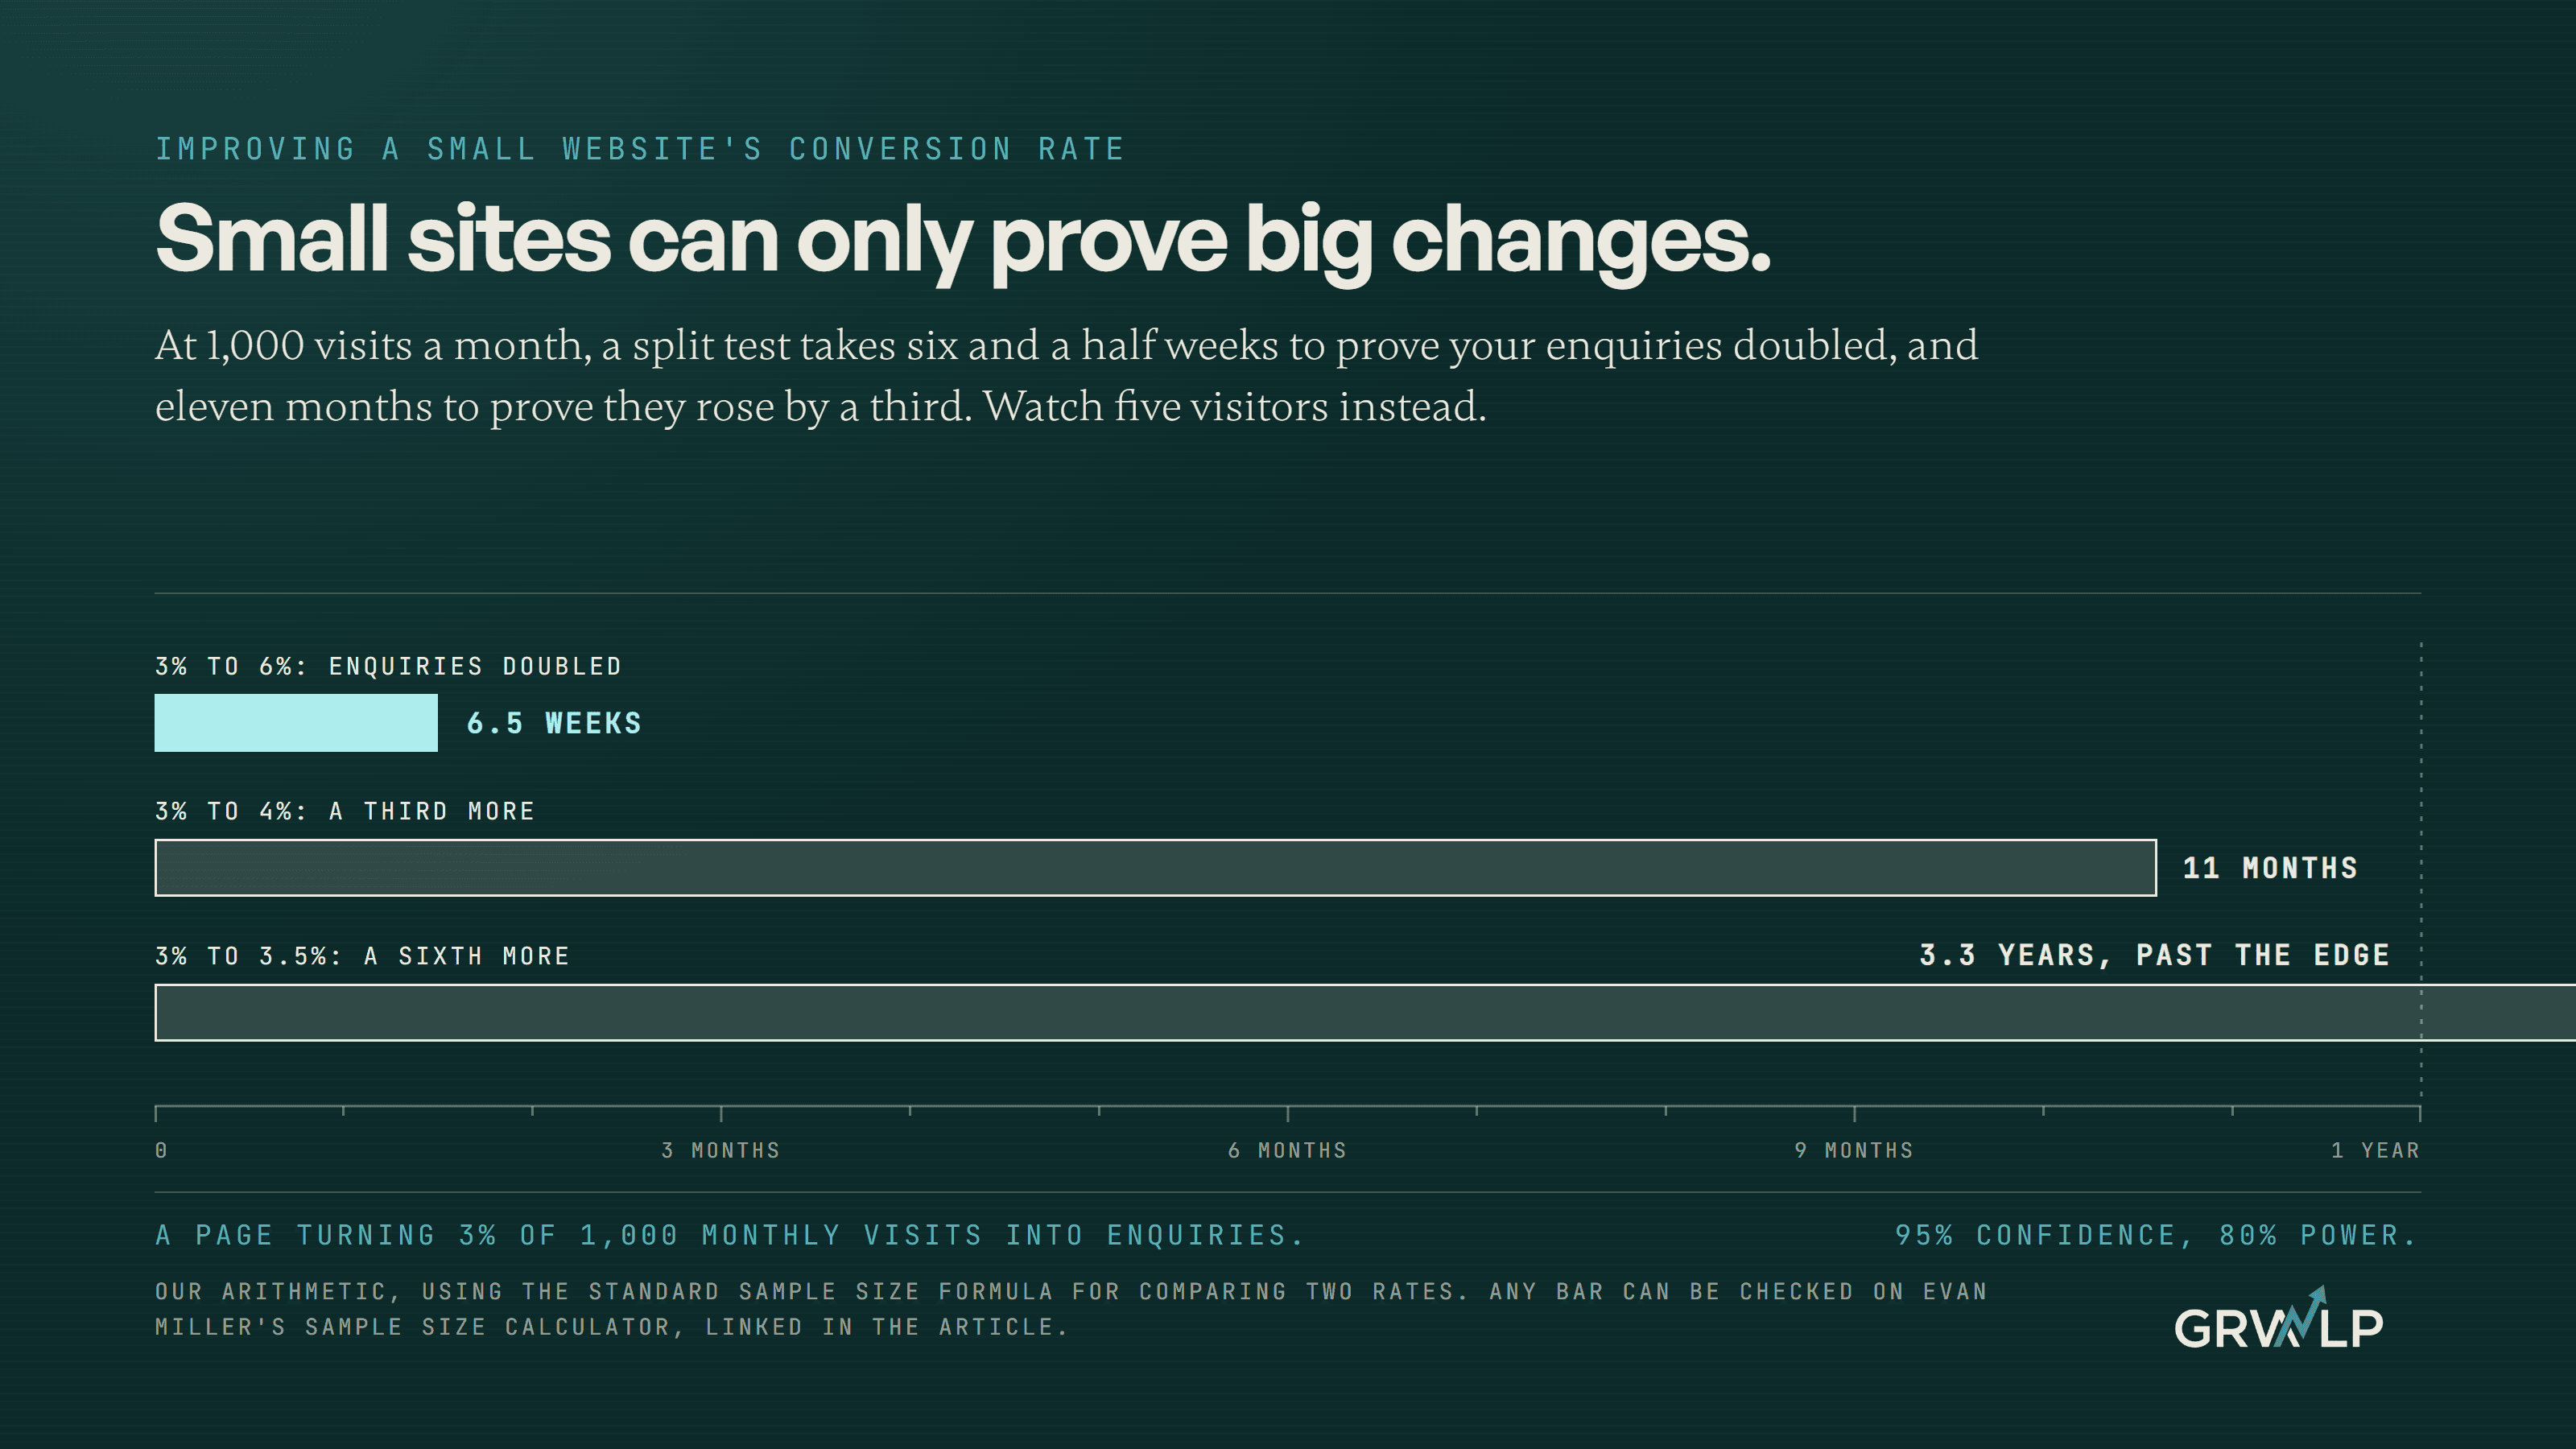
Almost every guide to this question ends at the same instruction: run an A/B test, also called a split test, where half your visitors see one version of a page and half see another. None of the ones we read prints the arithmetic. Here it is. A site with 1,000 visits a month that turns 3% of them into enquiries would need about 10,600 visits, eleven months, to prove a new page lifts that to 4%. To prove a lift to 3.5%, it would need more than three years. By then you would have changed the page for other reasons anyway.
So this is the version for a website with hundreds or a few thousand visits a month. If yours produces no enquiries at all, start with my website doesn't produce leads instead. This one is for the site that gets some and should get more.
What counts as a conversion on a small business website?
The thing you want a visitor to do. For a service business that is an enquiry, in whatever form it arrives: a form, a phone call, a WhatsApp message, a booking. Your conversion rate is enquiries divided by visits.
The trap is that most websites only count one of those. Google Analytics 4 measures some actions automatically, and its list of what it measures by itself includes starting a form, submitting a form and clicking a link to another website. A tap on your phone number is not on that list. A WhatsApp chat link goes to another website, so by Google's own definition it is counted as an outbound click, mixed in with every other link that leaves your site.
So a plumber whose customers mostly call can end up "improving" a rate that only measures forms. Move the phone number down the page to make room for a form, and the measured rate goes up while the phone goes quiet. Before you change anything, make sure calls, WhatsApp taps and forms are each counted as their own enquiry. Google Analytics calls these key events, and its help pages explain how to mark one.
Why can't a small business just run an A/B test?
Because a split test needs enough visits to tell a real difference from luck, and at small business traffic that takes longer than the page will stay the same.
Here is our arithmetic for a page that turns 3% of its visitors into enquiries, using the standard formula for comparing two rates, at 95% confidence and 80% power, which are the usual settings. You can put the same numbers into Evan Miller's sample size calculator and check any row.
How long a split test takes on a page that turns 3% of visitors into enquiries
| The lift you want to prove | At 500 visits a month | At 1,000 visits a month |
|---|---|---|
| 3% to 3.5%, a sixth moreAbout 39,500 visits in total | 6.6 years | 3.3 years |
| 3% to 4%, a third moreAbout 10,600 visits in total | 21 months | 11 months |
| 3% to 6%, doubleAbout 1,500 visits in total | 3 months | 6.5 weeks |
Even at 5,000 visits a month, proving the lift by a sixth takes about eight months. Read the last row twice. A small site can prove a change that doubles its enquiries, quickly. It cannot prove a change that adds a sixth more, at all, on any timescale a business plans in. That is the honest rule for a small website: if you need a statistics test to see the difference, the difference is too small to matter yet. Go and look for the big one.
What should I do instead of an A/B test?
Watch five people.
In 2000, Jakob Nielsen of Nielsen Norman Group published why you only need to test with five users: a first study with five participants finds 85% of the usability problems, and "the best results come from testing no more than 5 users and running as many small tests as you can afford." His finding is about watching people you have recruited try a task, and he notes it holds for "comparable users", so test each very different kind of customer separately. But the principle carries to a small site: you learn most from the first handful of people you actually watch.
You do not have to recruit anyone. Microsoft Clarity records how real visitors use your pages, and Microsoft's own documentation says Clarity is a free service forever, with no obligation to upgrade (it is not for sites aimed at under 18s). Its heatmaps have no minimum traffic limitation, which matters when you have hundreds of visits rather than millions.
The method is plain:
Count
Make sure forms, calls and WhatsApp taps are each recorded, and write down last month's number of enquiries.
Watch
Filter the recordings to visitors who reached your service or contact page and did not enquire. Watch five on a phone, start to finish, and write one line for each: where did they stop?
Change one thing
Fix the stop that repeats. One change, not five, or you will not know which one worked.
Compare
Count the next full month's enquiries the same way and set it next to the last. Note anything else that changed, such as an ad campaign or the season.
What should I look for in the recordings?
Clarity flags the moments for you. Its documentation defines rage clicks, where "a user repeatedly clicked in a clustered area within a brief period", and dead clicks, where "a user clicked somewhere, but there was no response". A rage click on your phone number means it is not tappable on that phone. A dead click on a photo of your work means people wanted to see more of it.
Then look for the quieter stops:
They scroll past the price, or look for one that is not there
If a visitor scrolls up and down the services page and leaves, the answer they wanted was missing. Our piece on what a cleaning company's website should include makes the case for showing a starting price wherever the job allows it.
They start the form and stop
Google Analytics records a form start and a form submission separately, so the gap between the two is your form's own leak. Watch where in the form the recordings end. The question about budget, the box asking for a full address, a phone field that rejects a plus sign. Our guide to quote forms lists the fields worth asking for and the ones that cost you people.
They wait
If a page takes long enough to appear that you can watch the visitor wait, speed is the leak. How to make your website load faster separates the two kinds of slow and what fixes each.
They tap to call and nothing happens after
The recording ends at the tap. Whether that call was answered is not on the website at all, which is why turning phone searches into calls spends half its length on what happens when you cannot pick up.
How do I know a change worked without an A/B test?
You compare months, and you are honest about what that proves.
Make one change, write the date down, and count enquiries for a full month after it, the same way you counted the month before. If the number moves a lot, the change probably worked. If it moves a little, you do not know, and that is fine: the table above says a small site cannot know small things. Keep the change if the recordings show people getting further, and go looking for the next stop.
This is evidence, not proof. A bank holiday, a new review or a competitor closing can move a month too. That is why the counting matters more than the testing: a dated note of every change, next to a monthly count of every kind of enquiry, is what lets you see a pattern over a year.
What happened when we checked our own counting?
For about three weeks in September 2026, our own website's Google Analytics recorded nothing.
The tracking code was there. It fired on every visit. But every visit arrived marked "analytics denied", even when the visitor clicked Accept all on the cookie banner, because the banner sent the visitor's yes in a format Google Tag Manager does not read. Microsoft Clarity, which loads separately, was recording sessions the whole time. Nothing on the site looked broken. We found it on 24 September while reviewing the site's search performance, fixed it the same day, and watched the next visit arrive marked as granted.
If we had spent those three weeks "improving our conversion rate", we would have been improving a number that was zero for a reason that had nothing to do with the page. Count first. A page cannot get better on a scoreboard that is switched off.
When should a small business pay someone to do this?
When you have counted, watched and changed a few things and the number has stopped moving, or when you cannot get the counting right on your own. Conversion work is part of our growth marketing service, and the Growth Audit is the paid version of everything above done for you once: a $500 flat fee, credited against any project signed within 60 days.
But start with the free version. A small site does not need a statistics test to get better. It needs someone to count honestly, then sit and watch five people try to reach you.
“If you need a statistics test to see the difference, the difference is too small to matter yet.”
Written by Oyekola Obajuwon